
Zero To One
SLO 계산해보기 본문
SLI, SLO, SLA란?
- SLI(서비스 수준 표시기,Service Level Indicator): 일정 기간 동안의 측정항목 및 대상 값(범위)
- SLO(서비스 수준 목표,Service Level Objective): SLA 목표를 나타내는 모든 SLI
- SLA(서비스 수준 계약,Service Level Agreement): SLO에 대한 법적 계약(예: 측정 방법, 알림, 서비스 크레딧 등)
서비스나 시스템에 있어 중요한 지표를 판단하는 근거
- 사용자가 직접 대면하는 시스템
- 보통 프론트엔드에 해당하며, 이 경우 가용성, 응답 시간, 처리량 이 중요.
- 저장소 시스템
- 응답 시간, 가용성, 내구성 이 중요.
- 빅데이터 시스템
- 데이터 파이프라인이 이에 해당하며, 처리량, 그리고 엔드포인트 간 응답 시간 이 중요.
척도의 표준화
SLO를 설정할 때, 주요 SLI의 정의를 표준화 하면 편리하다
ex)
- 집계 간격: 5분
- 집계 범위: 하나의 클러스터에서 수행되는 모든 태스크
- 측정 빈도: 매 10분
- 집계에 포함할 요청: 전체 HTTP GET 요청
목표설정
- GET 호출의 99%는 10ms 이내에 수행되어야 한다
Apdex score
https://godekdls.github.io/Prometheus/practices.histograms/
Histograms and summaries
Histogram과 summary의 차이점과 각각의 활용법
godekdls.github.io
SRE는 구글에서 만든 책이 있다.
https://sre.google/sre-book/table-of-contents/
Google - Site Reliability Engineering
sre.google
위 사이트를 참고해서 SLO가 요청의 99%를 10ms 이내에 처리되어야 한다 라고 설정했을시, 목표가 달성 되었는지 확인해 보도록 하자
시작
(nginx-controller, 프로메테우스, 그라파나, k6설치)
관측값의 특정 버킷에 속하는 관측값을 계산해보자
1. localhost로 요청을 여러번 보내기 위해 다음과 같은 코드를 실행시킨다.
//k6.js
//실행 명령어 : k6 run -u 1 -i 100 k6.js

import http from 'k6/http';

export default function () {
  http.get('http://localhost');
}
2. nginx_ingress_controller_request_duration_seconds_bucket 을 검색해보면 결과는 다음과 같다.

bucket이란 히스토그램상에서
막대 하나와 같다
le는 무엇의 약자인지는 잘 모르겠다. (공식문서를 좀 더 자세히 봐야겠다)
le=0.005는 0부터 0.005를 나타내고, le=0.01은 0.005부터 0.01을 나타낸다.
이제 조건을 줘보자.
nginx_ingress_controller_request_duration_seconds_bucket{method="GET",le="0.01"}GET요청이 10ms인 버켓을 찾아보면 결과는 다음과 같다

status='200'인 것이 2643개 있고, status='304'가 2개, status='404'가 1개 있다
이것들을 모두 더한다
sum(nginx_ingress_controller_request_duration_seconds_bucket{method="GET",le="0.01"})결과는 다음과 같다

3.
다음으로 API 호출 횟수 를 구해보자.
nginx_ingress_controller_request_duration_seconds_count결과는 다음과 같다

합계를 구해보면 다음과 같다

이 둘을 서로 나누어 주면 SLO가 요청의 99%를 10ms 이내에 처리되었는 가를 만족시키는지 볼 수 있다
sum(nginx_ingress_controller_request_duration_seconds_bucket{method="GET",le="0.01"})
/
sum(nginx_ingress_controller_request_duration_seconds_count)
결과는 다음과 같다

대략 99.9%가 나온 것을 볼 수 있다
따라서 SLO가 달성되었다는 것을 알 수 있다
그라파나에서도 쉽게 볼 수 있다
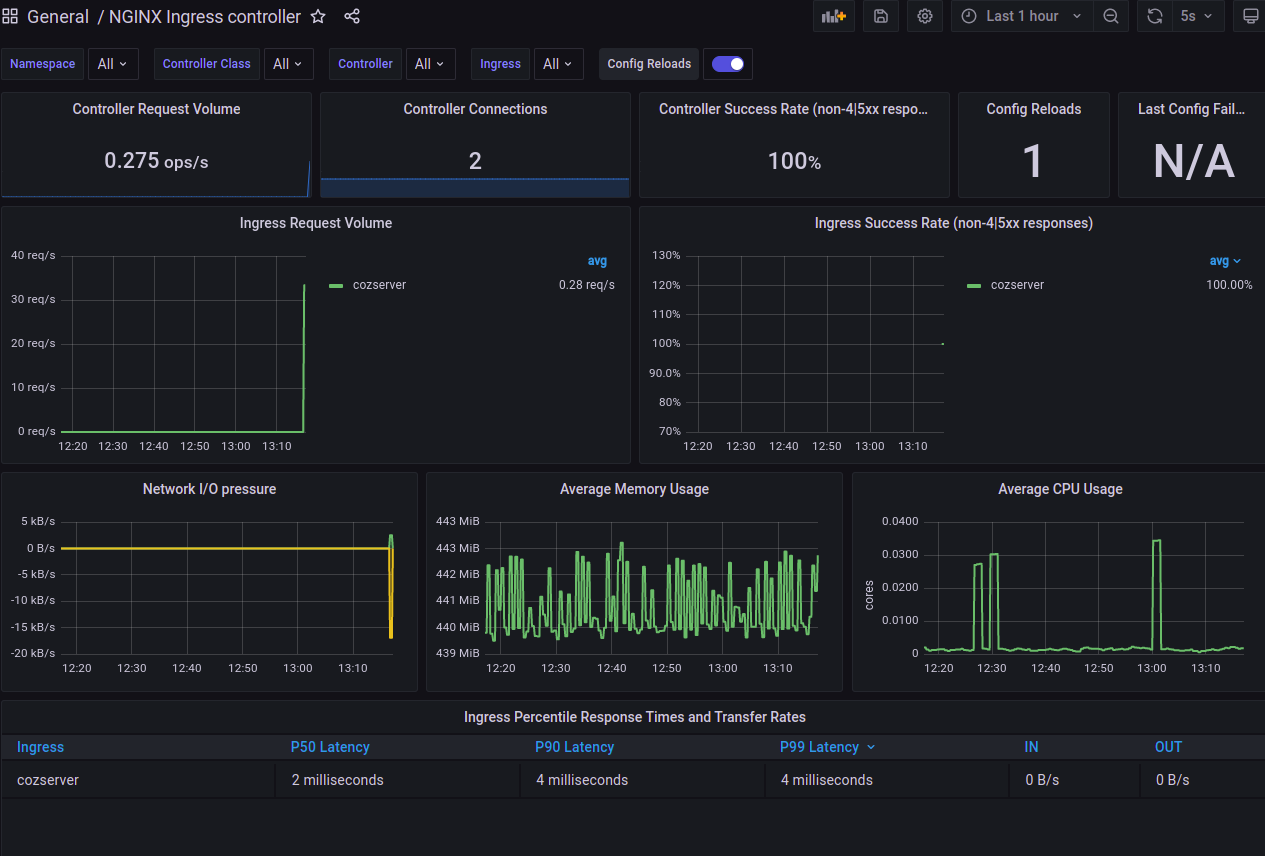
P99 Latency가 4 milliseconds 로써 10 miliseconds 안에 들어와 있다
https://prometheus.io/docs/practices/histograms/
https://medium.com/@meetutarun16/monitor-your-applications-on-grafana-using-prometheus-6d0ab1e7a182
그라파나에서 nginx 대시보드를 설정하는 법
그라파나 메인 -> 왼쪽 + -> import -> 9614 입력
https://grafana.com/grafana/dashboards/9614
NGINX Ingress controller dashboard for Grafana | Grafana Labs
Ingress-nginx supports a rich collection of prometheus metrics. If you have prometheus and grafana installed on your cluster then prometheus will already be scraping this data due to the scrape annotation on the deployment.
grafana.com
'서비스모니터링' 카테고리의 다른 글
| 성능테스트 정리할것 (0) | 2022.05.12 |
|---|---|
| The connection to the server localhost:8080 was refused - did you specify the right host or port? 오류 해결 (0) | 2022.05.10 |
| “네가지 황금 시그널(The Four Golden Signals)”로 SRE 모니터링의 주요 측정 항목 4가지 (0) | 2022.05.09 |
| ingress-nginx-controller 설치 에러 (0) | 2022.05.09 |
| Auto Scaling + CloudWatch를 이용한 알림(webhook & terraform) (0) | 2022.05.09 |

